March 20, 2024
CPI Trim
Just because the news yesterday was still confused about what the different CPI measures mean and if one month of change really means much and if it does what that is, let's take a look.
Folks seem to be confused how CPI is a measure of "inflation" and what the index is a representation of.
It is in the name and description, but it is still confusing.
The Consumer Price Index (CPI) represents changes in prices as experienced by Canadian consumers. It measures price change by comparing, through time, the cost of a fixed basket of goods and services.
"Price change" require a time dimension, so a single measure of a single month doesn't mean what most people think it means. Indeed, a single month of headline CPI means very little when it comes to talking about inflation.
I have my own personal favourite measure of CPI: year over year CPI Trim.
Why is this my favourite measure of CPI? Because the basket of goods StatCan selects is not really a truly objective list of goods. And, it doesn't represent a working class view of inflation changes. However, you can look at what the average change of the central goods i in their basket to see what is driving real core price changes. Then, you can look at what is being trimmed and those likely tell you what working people are internalizing. The sticker shocks, as it where
Of course, you have to look at all the different measures over a longer period of time to actually see why we measure these things the way that Statistics Canada does. They care about broad economic CPI data, and not really this or that groups' interpretation of price changes.
For working people, we are not seeing a collapse in that price growth across the economy. Stuff is still really expensive and still getting more expensive too fast.
_Measure_of_core_inflation_based_on_a_trimmed_mean_approach,_CPI-trim_(year-over-year_percent_change)_2_3_4_5_6_chartbuilder.png)
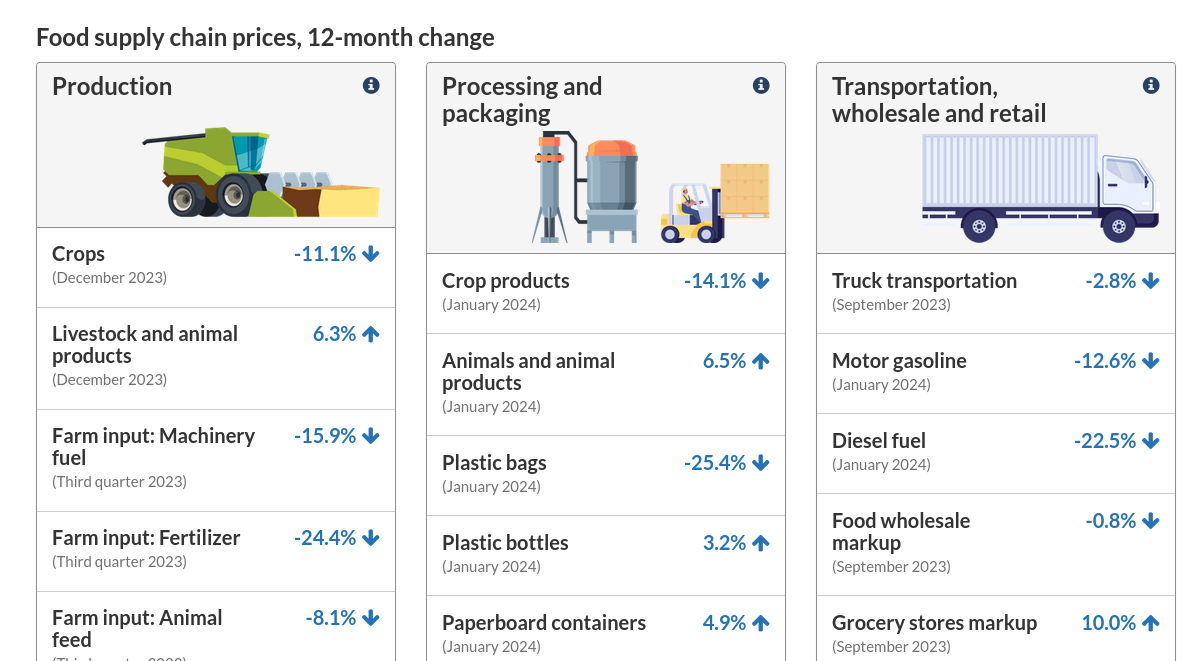
Let's look at food because it is one of the major pieces of the basket of goods we care about as workers—because it is something along with shelter that we cannot really live without.
- From February 2021 to February 2024, prices for food purchased from stores increased 21.6%.
Food price increases are slowing as the major cost pressures eased last year. However, this should not be over-stated.
Food is affected by many different cost pressures, mostly related to climate change and shipping costs. These cost pressures are baked into the price of food well before they are purchased by consumers.
_CPI__Food_purchased_from_stores_chartbuilder.png)
Which parts are reducing price increases for consumers? Not the underlying price of production of food, but shipping and storage costs. Basically, the price of oil (and oil and gas-related products such as fertilizer) has reduced so much as to slow the overall growth of food prices to align with other products.

Grocery companies are using the slight decline in input prices to drive profitability of their food sales (which came under political pressure during the 2023 selling season).
And, these cost pressures are not going anywhere. So, looking at price increases and "inflation" is going to have to take into consideration the cost impacts of climate change and the transition to different energy sources.
Neoclassical conceptions of inflation are part of the issues here. CPI only measures changes in prices as a proxy for the value of money. The value of food and climate change is not really impacted directly by the printing of money.
So, CPI is fine as a measure of price pressures. But, if we are talking about interest rates and inflation, that's not really where we need to be looking.
Life Satisfaction
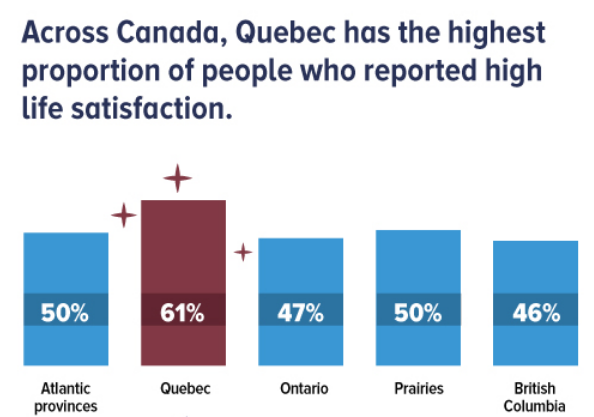
Statistics Canada releases lots of good statistical measures. This one means next to nothing, but it is fun to wonder why Quebec has higher whatever this is compared to the rest of the country.

Looking at the list of countries competing with highest life satisfaction, it looks like it is simply a measure of comprehensiveness of social programs.