April 15, 2024
Canadian Manufacturing Sales
Canadian manufacturing is stuck in the doldrums.
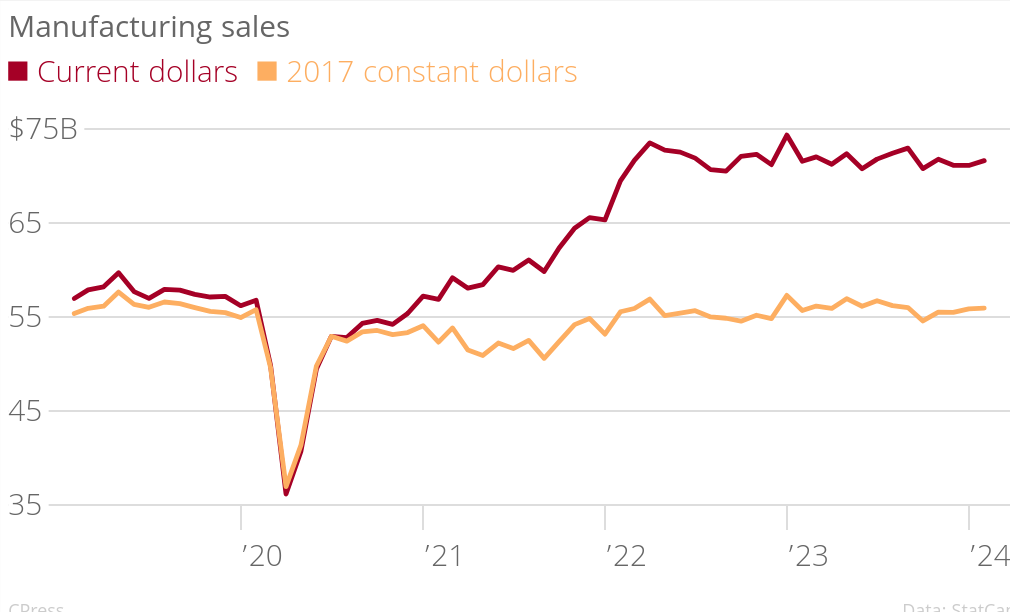
Canadian manufacturing sales increased 0.7% to $71.6 billion in February, on elevated sales in 13 of 21 subsectors, mainly driven by higher sales of petroleum and coal (+4.3%) as well as electrical equipment, appliance and component (+12.6%) products. Meanwhile, the chemical subsector (-5.5%) recorded the largest decline.
And, the classical economics favourite (part) measures of where real inflation might go: inventories declined and capacity utilization rates when up in February.
Capacity utilization has been fluctuating, but there does to seem to be a longer-term trend downward over 2023.
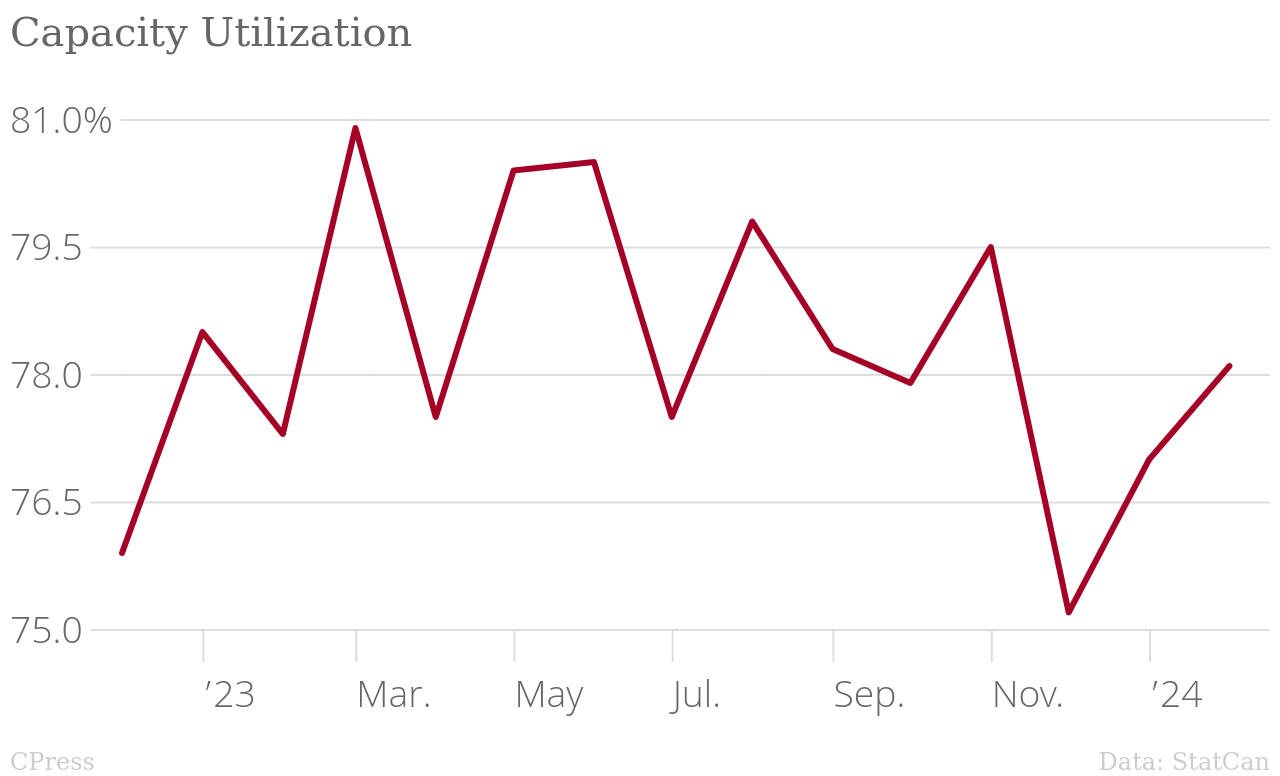
The not so great employment numbers (longer long-term unemployment) along with unchanging or only slightly declining trends in capacity utilization are there is little reason to think inflation is going to be declining very fast.
Wages
In 2022, real wages were down.
In 2022, tax filers reported median wages of $45,380, down 1.6% from 2021 after adjusting for inflation.
… inflation-adjusted median annual wages in 2022, with the largest declines in educational services (-5.3%) and public administration (-5.2%). Those working in the transportation and warehousing (-3.2%), agriculture, forestry, fishing and hunting (-2.5%), utilities (-2.5%), construction (-2.2%), and health care and social assistance (-2.1%) sectors also saw declines in their inflation-adjusted median annual earnings.
.png)
| Sector | % Change |
|---|---|
| educational services | -5.3 |
| public administration | -5.2 |
| transportation and warehousing | -3.2 |
| agriculture forestry fishing and hunting | -2.5 |
| utilities | -2.5 |
| construction | -2.2 |
| health care and social assistance | -2.1 |
The groups that saw wage increases above inflation was the lowest income workers. It is one of the best news stories come out of 2022. But, while this is decent, it seems to have completely bottomed out most of the way through 2023.
- 10.9% increase in earnings at the first wage decile and a 5.5% increase at the second decile.
Credit in the USA
In our ongoing following of stats on how American working families are really doing, some credit card graphs.
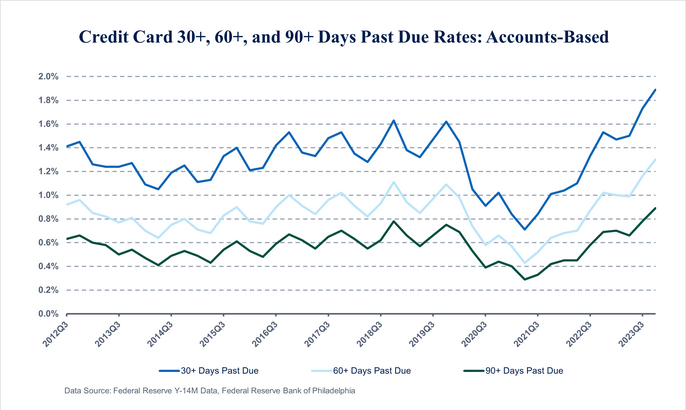
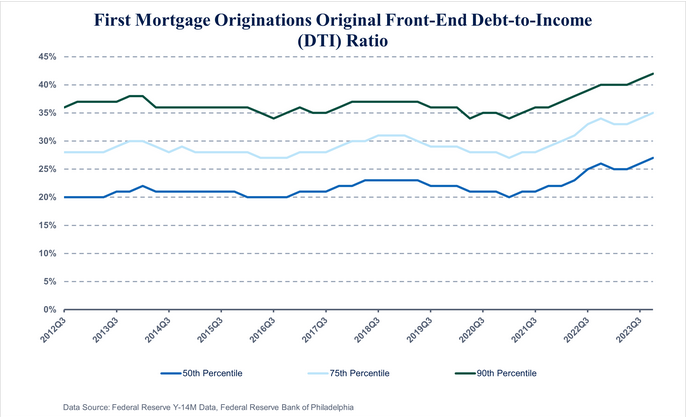
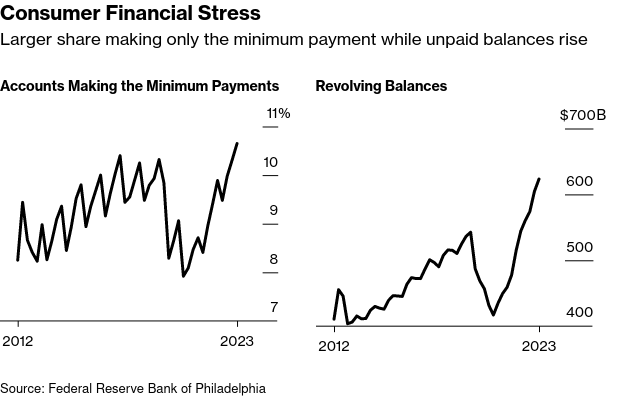
The steady growth in the factors showing distress of USA borrowers shows that USA consumers are unhappy for good reasons. Nothing drives negative sentiment better than not being able to pay your credit card bill.
The recent report from Bolhuis et al. (which includes Lawrence Summers) shows why this is. If you count the cost of borrowing and the price of money in the CPI measures like we did in the 80s, inflation is much higher than it is today.
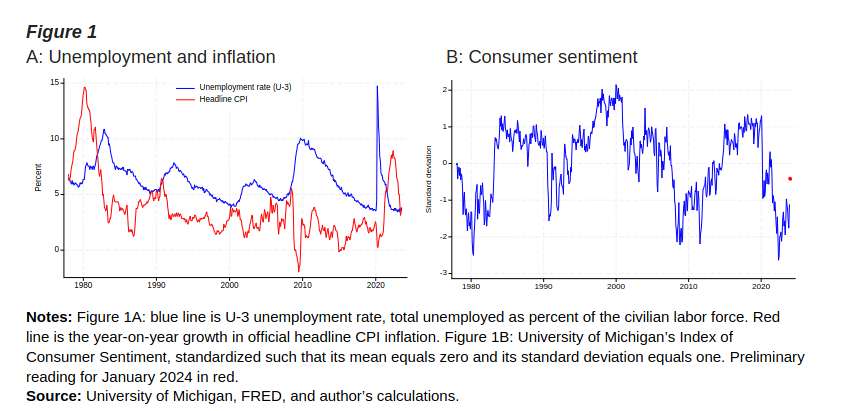
Now have a look at it compared with the way we used to calculate CPI in the USA.
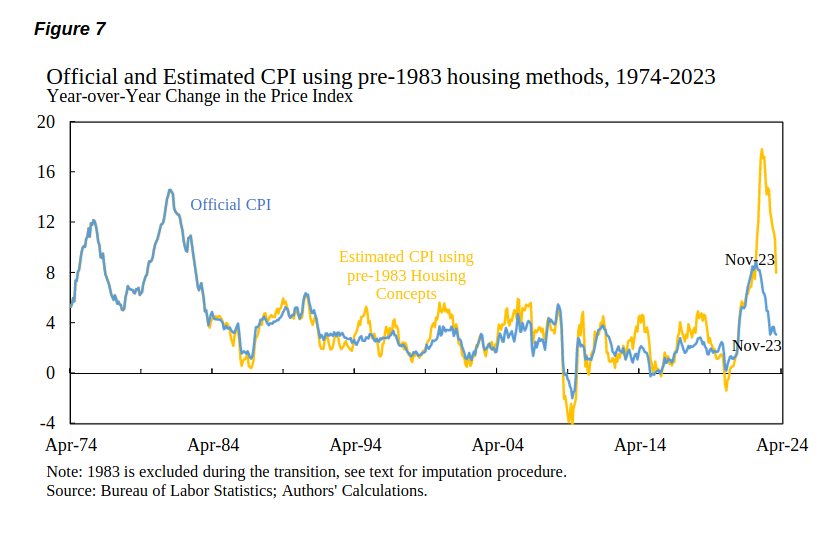
And, now including interest payments.
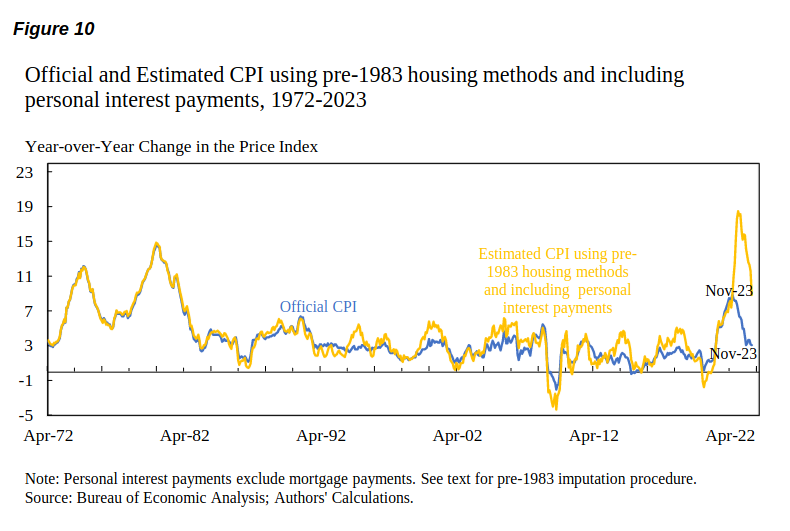
These larger fluctuation are explained by Americans being in larger debt now than they have ever been and interest rates have corrected post pandemic. That means that when the central bank adjusts their interest rate the knock on effect is that inflation for working people is made much worse than the headline figures.
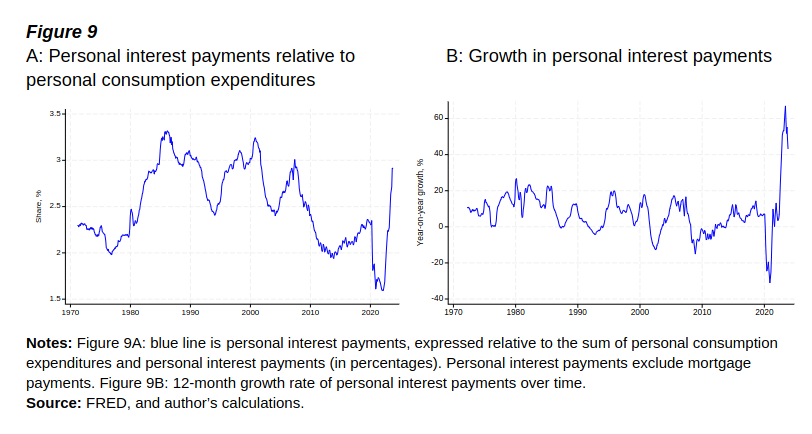
It is hard to wonder why Americans are not excited by the so-called "booming" economy when interest rates are up, real wages are stagnant, costs are through the roof, and debt-driven consumption is harder.
There is a solution to all this. But, it would take some interesting examination of debt.
Labour productivity
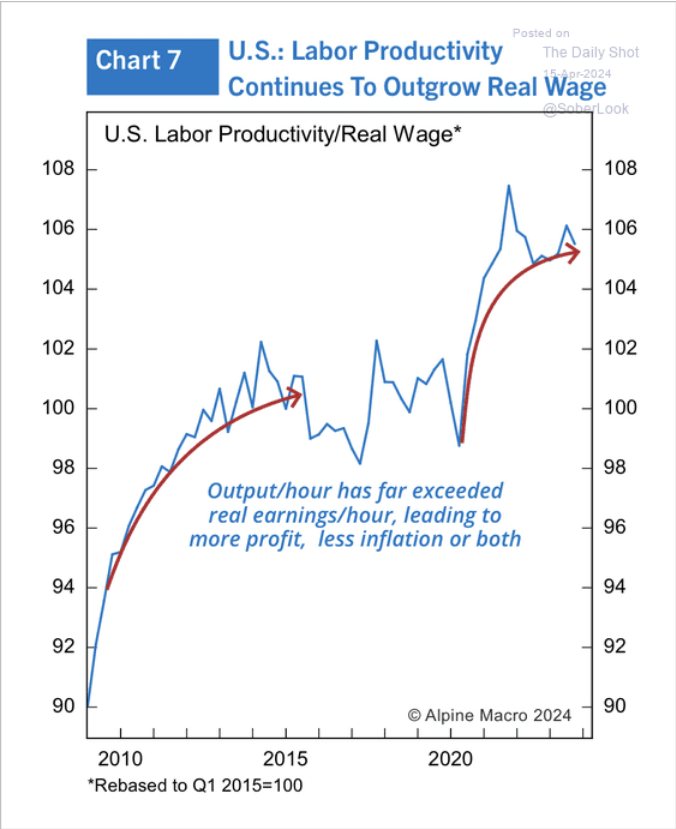
In the USA, labour productivity is outgrowing wage.
Which is an indication of wealth transfer from workers to capital.
That is not surprising, but the rate of transfer is. Those are significant curves upward outside the five years from 2015 to 2020 when investment was extremely weak.
